SaaS businesses grow best when decisions are grounded in data, not instinct. With Power BI, teams can surface key insights that drive retention and revenue. In a model built on recurring revenue and long-term customer value, understanding what drives growth, and what hinders it, is essential.
Yet many companies still approach pricing, feature packaging, and customer acquisition with educated guesses. Without clear visibility into user behavior, retention patterns, and acquisition costs, even the most well-intentioned strategies risk misalignment with actual performance.
This is where data visualization becomes helpful and foundational. When usage, conversion, and financial metrics are translated into intuitive dashboards, decision-makers can move beyond assumptions. Every user interaction becomes an insight. Every metric tells a story of what to do next.
With the right metrics, SaaS leaders can confidently answer critical questions like:
- Which plans are driving sustainable revenue?
- Where are users dropping off, and why?
- Are marketing dollars generating long-term value or short-term signups?
- What features actually influence upgrades, renewals, or churn?
Data clarity enables strategic clarity. It turns guesswork into growth.
Free, Basic, Pro & Beyond: Comparing All Plan Levels
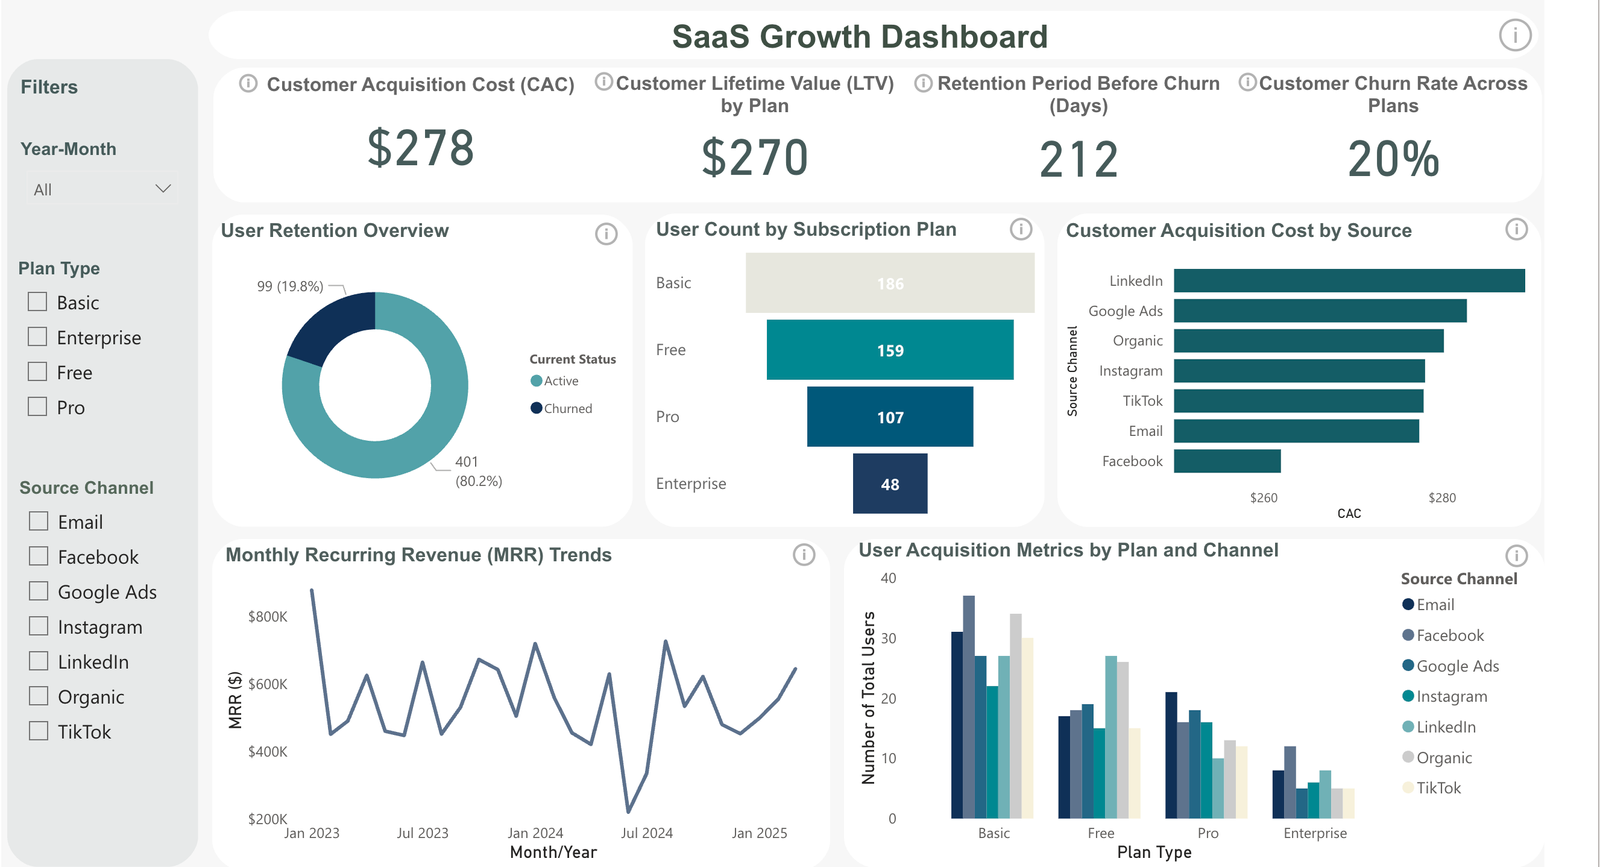
Understanding the performance of subscription tiers is one of the most valuable, yet often underutilized, insights available to SaaS companies. A high-level dashboard showing “User Count by Subscription Plan” can immediately reveal how users are distributed across free and paid plans. However, the real strategic value comes when this data is analyzed in combination with retention and engagement metrics, offering a deeper and more actionable narrative.
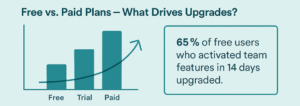
A productivity SaaS company used Power BI to track plan transitions and discovered that 65% of free users who activated team collaboration features within the first 14 days converted to a paid plan. By emphasizing these features during onboarding, they increased their paid conversion rate by 28% in one quarter, without changing pricing.
For example, a high churn rate among free users might not be surprising, but similar trends within paid tiers could point to issues such as a pricing mismatch, ineffective onboarding, or a misalignment between features and user expectations. Tracking how users transition between plans, particularly the moments or features that prompt an upgrade, provides crucial clues about what aspects of the product deliver real perceived value.
By closely examining this data, companies can fine-tune their pricing strategies based on actual retention and conversion behavior. Plans that consistently underperform can be restructured or retired to protect revenue margins. Features can be more strategically gated to encourage upgrades, maximizing both user satisfaction and customer lifetime value (LTV). Ultimately, aligning the user experience with the promises of each tier helps reduce churn and enhances overall profitability.
Understanding how many users are on each plan is only part of the picture, what truly matters is whether those plans contribute to sustainable, long-term growth. With the right data, that insight becomes clear.
Measuring the True ROI of Marketing Spend
Marketing should be treated as an investment that drives growth, not simply as a cost center. However, without clear attribution and ROI tracking, budgets can easily be misallocated. A well-structured dashboard is essential for revealing which acquisition channels are actually contributing to long-term value. For instance, visualizing Customer Acquisition Cost (CAC) by source allows teams to compare the relative cost of acquiring users through paid campaigns versus organic methods. Yet CAC alone doesn’t provide a complete picture, it must be examined alongside Customer Lifetime Value (LTV) to assess the true return on each marketing dollar.
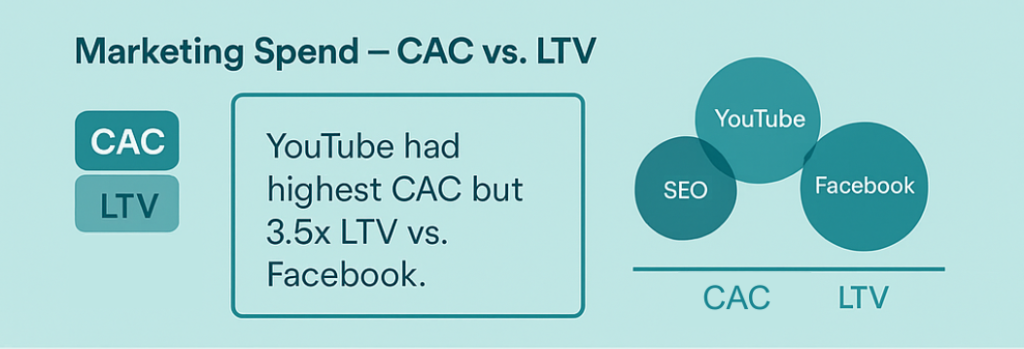
A B2B SaaS firm compared CAC and LTV across channels using Power BI and discovered that while YouTube ads had the highest CAC, they produced the highest LTV users, 3.5x that of their Facebook-acquired users. Redirecting 20% of their budget toward YouTube led to a 15% boost in overall customer profitability.
When CAC and LTV are analyzed together, important patterns surface. High-cost channels like LinkedIn might yield customers with greater retention and higher lifetime value, making them more efficient than they first appear. In contrast, some campaigns may generate volume but attract users who churn before becoming profitable. Even organic channels, while often slower to scale, may drive users who convert at lower rates but deliver more margin over time.
This kind of data-driven analysis enables SaaS companies to allocate marketing spend with greater precision. Rather than focusing purely on the cheapest sources, teams can double down on channels that bring in high-retention, high-usage customers. Dashboards that link acquisition efforts to downstream metrics help answer critical questions, such as where to increase investment, where to pull back, and which campaigns actually drive sustainable growth. Overall, marketing analytics shouldn’t stop at the point of signup, the real goal is to understand how each dollar contributes to long-term, meaningful business impact.
Using Active Performance Insights to Improve Business Plans
Effective strategic decisions in SaaS, whether related to product development, pricing, or customer success, must reflect how users are currently engaging with and valuing the product. Tracking Monthly Recurring Revenue (MRR) by plan or user cohort are especially powerful for identifying which segments are contributing most to growth. By analyzing trends in MRR growth, contraction, and churn, companies can determine which plans are thriving and which may require adjustments.
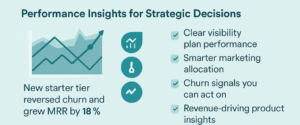
A customer support SaaS company monitored MRR across user cohorts and noticed that a recent price increase triggered a sharp rise in cancellations among smaller teams. By introducing a new “starter” tier tailored to their needs, the company reversed the churn trend and restored momentum, resulting in an 18% increase in net MRR over two months.
Retention and engagement indicators offer similarly important insights. They reveal how long customers typically stay before downgrading or canceling, highlighting whether a specific plan is falling short of expectations or simply doesn’t fit the target audience. When paired with behavioral trends, these metrics empower strategic initiatives. Sustained user value, for instance, can validate pricing increases. Underperforming tiers can be redesigned or sunset. Product teams can prioritize roadmaps around the habits of high-value users. Even forecasting becomes more precise when it’s informed by how different user groups behave over time.
By staying closely aligned with evolving user patterns, rather than relying on lagging financial reports or anecdotal feedback, companies can act more decisively and adapt with confidence. This kind of insight-driven planning ensures every business move is rooted in measurable value and aligned with customer behavior.
Conclusion
In today’s SaaS landscape, understanding what drives customer value, retention, and revenue is a competitive requirement. The ability to surface actionable insights through well-designed dashboards enables teams to make smarter, faster decisions across pricing, marketing, and product development. With clear visibility into what’s working, what’s not, and where untapped growth opportunities exist, businesses can shift from reactive guesswork to proactive strategy.
The companies that scale efficiently aren’t just measuring, they’re continuously learning and evolving based on real data, not assumptions. If your team is ready to move beyond scattered spreadsheets and shallow metrics, now is the time to invest in the tools and systems that bring clarity.
How We Can Help
At Analitifi, we streamline the entire data journey, from integration and cleaning to analysis and visualization, so you can focus on scaling your business while we handle the heavy lifting behind the scenes. No need to be a data expert; we turn complex data into clear, actionable insights to support smarter decision-making.
Our process is straightforward:
- Initial Consultation: We begin by understanding your business goals, whether it’s improving retention, optimizing pricing tiers, or measuring marketing ROI, and identifying the key metrics that matter most.
- Tailored Data Strategy: Based on your objectives, we design a customized data framework to track performance across plans, campaigns, and cohorts, ensuring you’re equipped to uncover actionable trends.
- Custom Dashboards & Reporting: We help you pinpoint which customers are worth acquiring, and which pricing plans actually retain users, so you scale smarter, not harder.
- Ongoing Training & Support: Our team provides continuous guidance so your staff can confidently use the tools, interpret the data, and adapt strategies as needed.
With Analitifi, business intelligence becomes a practical tool, not a technical hurdle. We help you harness your data to improve retention, sharpen your marketing, and drive revenue, without the complexity.